|
We want to solve this system of linear inequalities:
|
$$\{\,\cl"tight"{\table y≥-2x-2; y≥-2}$$ |
That is, we want to find the $(x,y)$ pairs that are solutions to both
inequalities. First, we need to graph the lines $y=-2x-2$
and $y=-2$. Look at the grids to the left. On the left grid, you
are looking at the graph of $y=-2x-2$. On the
right, you are looking at the graph of $y=-2$.
Here is a way to see if the point $(1,2)$ is a solution to the
first inequality:
$y≥-2x-2$ for $(1,2)$ ?
$2≥-2(1)-2$ ?
$2≥-2-2$ ?
$2≥-4$ ?
YES
Test each point in the table below in both inequalities. Also indicate which points are
solutions to the system of two inequalities (that is, which points are a solution to both the
first inequality and the second inequality).
| Point
| Solution to
$y≥-2x-2$?
| Solution to
$y≥-2$?
| Solution
to both?
|
|
Click
to look at the graphs of the inequalities. Are the
blue points that are solutions to
$y≥-2x-2$ in the shaded region on the left grid?
| |
|
Are the blue points that are solutions to
$y≥-2$ in the shaded region on the right?
| |
|
Name the blue points on the grid that are solutions to the entire
system (both inequalities).
| |
Click to see
$y≥-2x-2$ and $y≥-2$ graphed together. The
dark blue section is the area where the
solution sets overlap.
The light blue section is the rest of the solution set of
$y≥-2$ and the pink section is the rest of the solution set of
$y≥-2x-2$.
|
Find on the graph the points you just listed. Are they in the dark
blue, the light blue, or the
pink section?
| |
|
Which colored section of the graph represents the solution set of the entire system of
inequalities?
| |
|
Now, let’s solve the system of linear inequalities:
|
$$\{\,\cl"tight"{\table y≥-4x-2; 3x+4y≤18}$$ |
The red line is the graph of $y=-4x-2$ and
the blue line is the graph of
$3x+4y=18$.
For each point in the table below, locate the point on the grid and
determine whether it is a solution to each inequality.
| Point | Solution to
$y≥-4x-2$?
| Solution to
$3x+4y≤18$?
| Solution
to both?
|
|
Click
to look at the graph of the inequalities. Remember that the dark blue
region is the graph of the solution set of the system of linear inequalities. Name the
point on the grid that lies in the solution set.
| |
|
Does your answer match your answer from the table?
| |
|
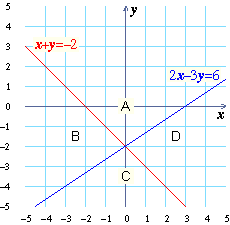
Now it’s your turn to solve the system of linear inequalities shown here:
| $$\{\,\cl"tight"{\table x,+,y,≥,-2; 2x,-,3y,≤,6}$$
|
The graphs of the lines $x+y=-2$
and $2x-3y=6$ are given on the
grid below. As you can see, the graphs of these two lines divide the grid
into four sections, which have been labeled A, B, C, and D.

Choose a point in each section of the grid above (A, B, C, and D), and fill in the table below.
| Section | Point | Solution to
$x+y≥-2$?
| Solution to
$2x-3y≤6$?
| Solution
to both?
|
|
Which sections (A, B, C, or D) are solutions to $x+y≥-2$?
| |
|
Which sections are solutions to $2x-3y≤6$?
| |
|
Which section is the solution set to the system of linear inequalities?
| |
|
Click to graph the two inequalities. Does the
dark blue section of the grid to the left correspond
to the solution set you just found?
| |